


WHO OWNS WHAT
The “Who Owns What” or WOW project is a collaborative research project focused on the tracking of media ownership and the design of an online interface with infographics that visualize the holdings of major media conglomerates. The project brings together media scholars and students at UC Santa Barbara and beyond to investigate the political economy and powerful global influence of media conglomerates, including Big Tech companies. The project was launched in fall 2021 and is co-led by Professors Jennifer Holt and Lisa Parks.
WOW Team
-

Jennifer Holt
Project Leader
-

Nat Cheyette
WOW Coordinator
-

Elijah Frankle
Graphic Designer
-

Juan Rivera Garnica
Student Researcher - 2023-24
-

Lisa Parks
Project Leader
-

Seth Ragonese
Student Researcher - 2021-22
-

Andrew Hansen
Student Researcher 2021-22
WOW Blog Post by Nat Cheyette, December 15, 2023
As the Who Owns What project continues to gather and analyze data relating to corporate ownership in media, we've repeatedly run into issues with corporate transparency. All of our data comes from companies' annual reports, which they are required to file by their corresponding government agency (Security and Exchanges Commission in the U.S.). The purpose of the annual report is to make sure that shareholders are aware of company operations, to prevent their being defrauded. However, although every annual report has the same sections–Risk Factors, Legal Proceedings, Market for the Registrant's Common Equity, etc.–the way companies fill them out varies extremely.
Take, for example, the Properties section. One of our current focuses is on the growth of data centers. Despite the amorphous connotations of "The Cloud," all computer activity everywhere takes up a lot of space in storage and processing, and all that space has to be owned and operated by somebody. Often the owner is Amazon, as Amazon Web Services has become an extremely popular vendor for server space. Since 2019, Amazon has disclosed the square footage AWS takes up–millions of feet, miles and miles of just computers. They also disclose the operating expenses they devote to AWS, a corresponding billions of dollars.
Apple, on the other hand, doesn't disclose any information on their annual reports about what it takes to run their iCloud product. They bundle up mentions of data centers in with the leases for their corporate and retail spaces and only give out their operating expenses in terms of "Research and Development" and "Selling, General, and Administrative," meaning the only picture one can get from their annual reports are extremely vague ones. Occasionally there are news reports related to their cloud storage, but these are often not sourced well enough to be relied upon.
This problem does not only affect U.S. companies. Juan Rivera Garnica, who is looking into the properties of Latin American media corporations, has run into similarly inconsistent information. Grupo Global, one of the largest, splits up their annual reports across mediums, and some of them, such as their radio and newspaper reports, are much more inconsistent than their television broadcast reports. Many of the companies diregard communicating about their subsidiaries altogether. This makes it difficult to perform meaningful analysis on how they're running, how many resources they are monopolizing, and how they are interacting with each other.
And they are interacting with each other. Comcast owns Telemundo, which gives it a decent stake in Latin American TV. And in 2019, a CNBC article claimed Apple was spending over $30 million per month on AWS and had signed an agreement to invest almost $2 billion in its growth over the coming years. As we discuss inconsistency in communication, we have to remember who benefits from what. By disclosing their properties data, Amazon gets to brag about the ubiquity of Amazon Web Services. By keeping their properties secret, Apple gets to hide where they're keeping people's information. I hope to give a more detailed report on this phenomenon in the future, but for now, going into the information we publish, keep in mind what isn't known, and why.
PROJECT GALLERY - 2022
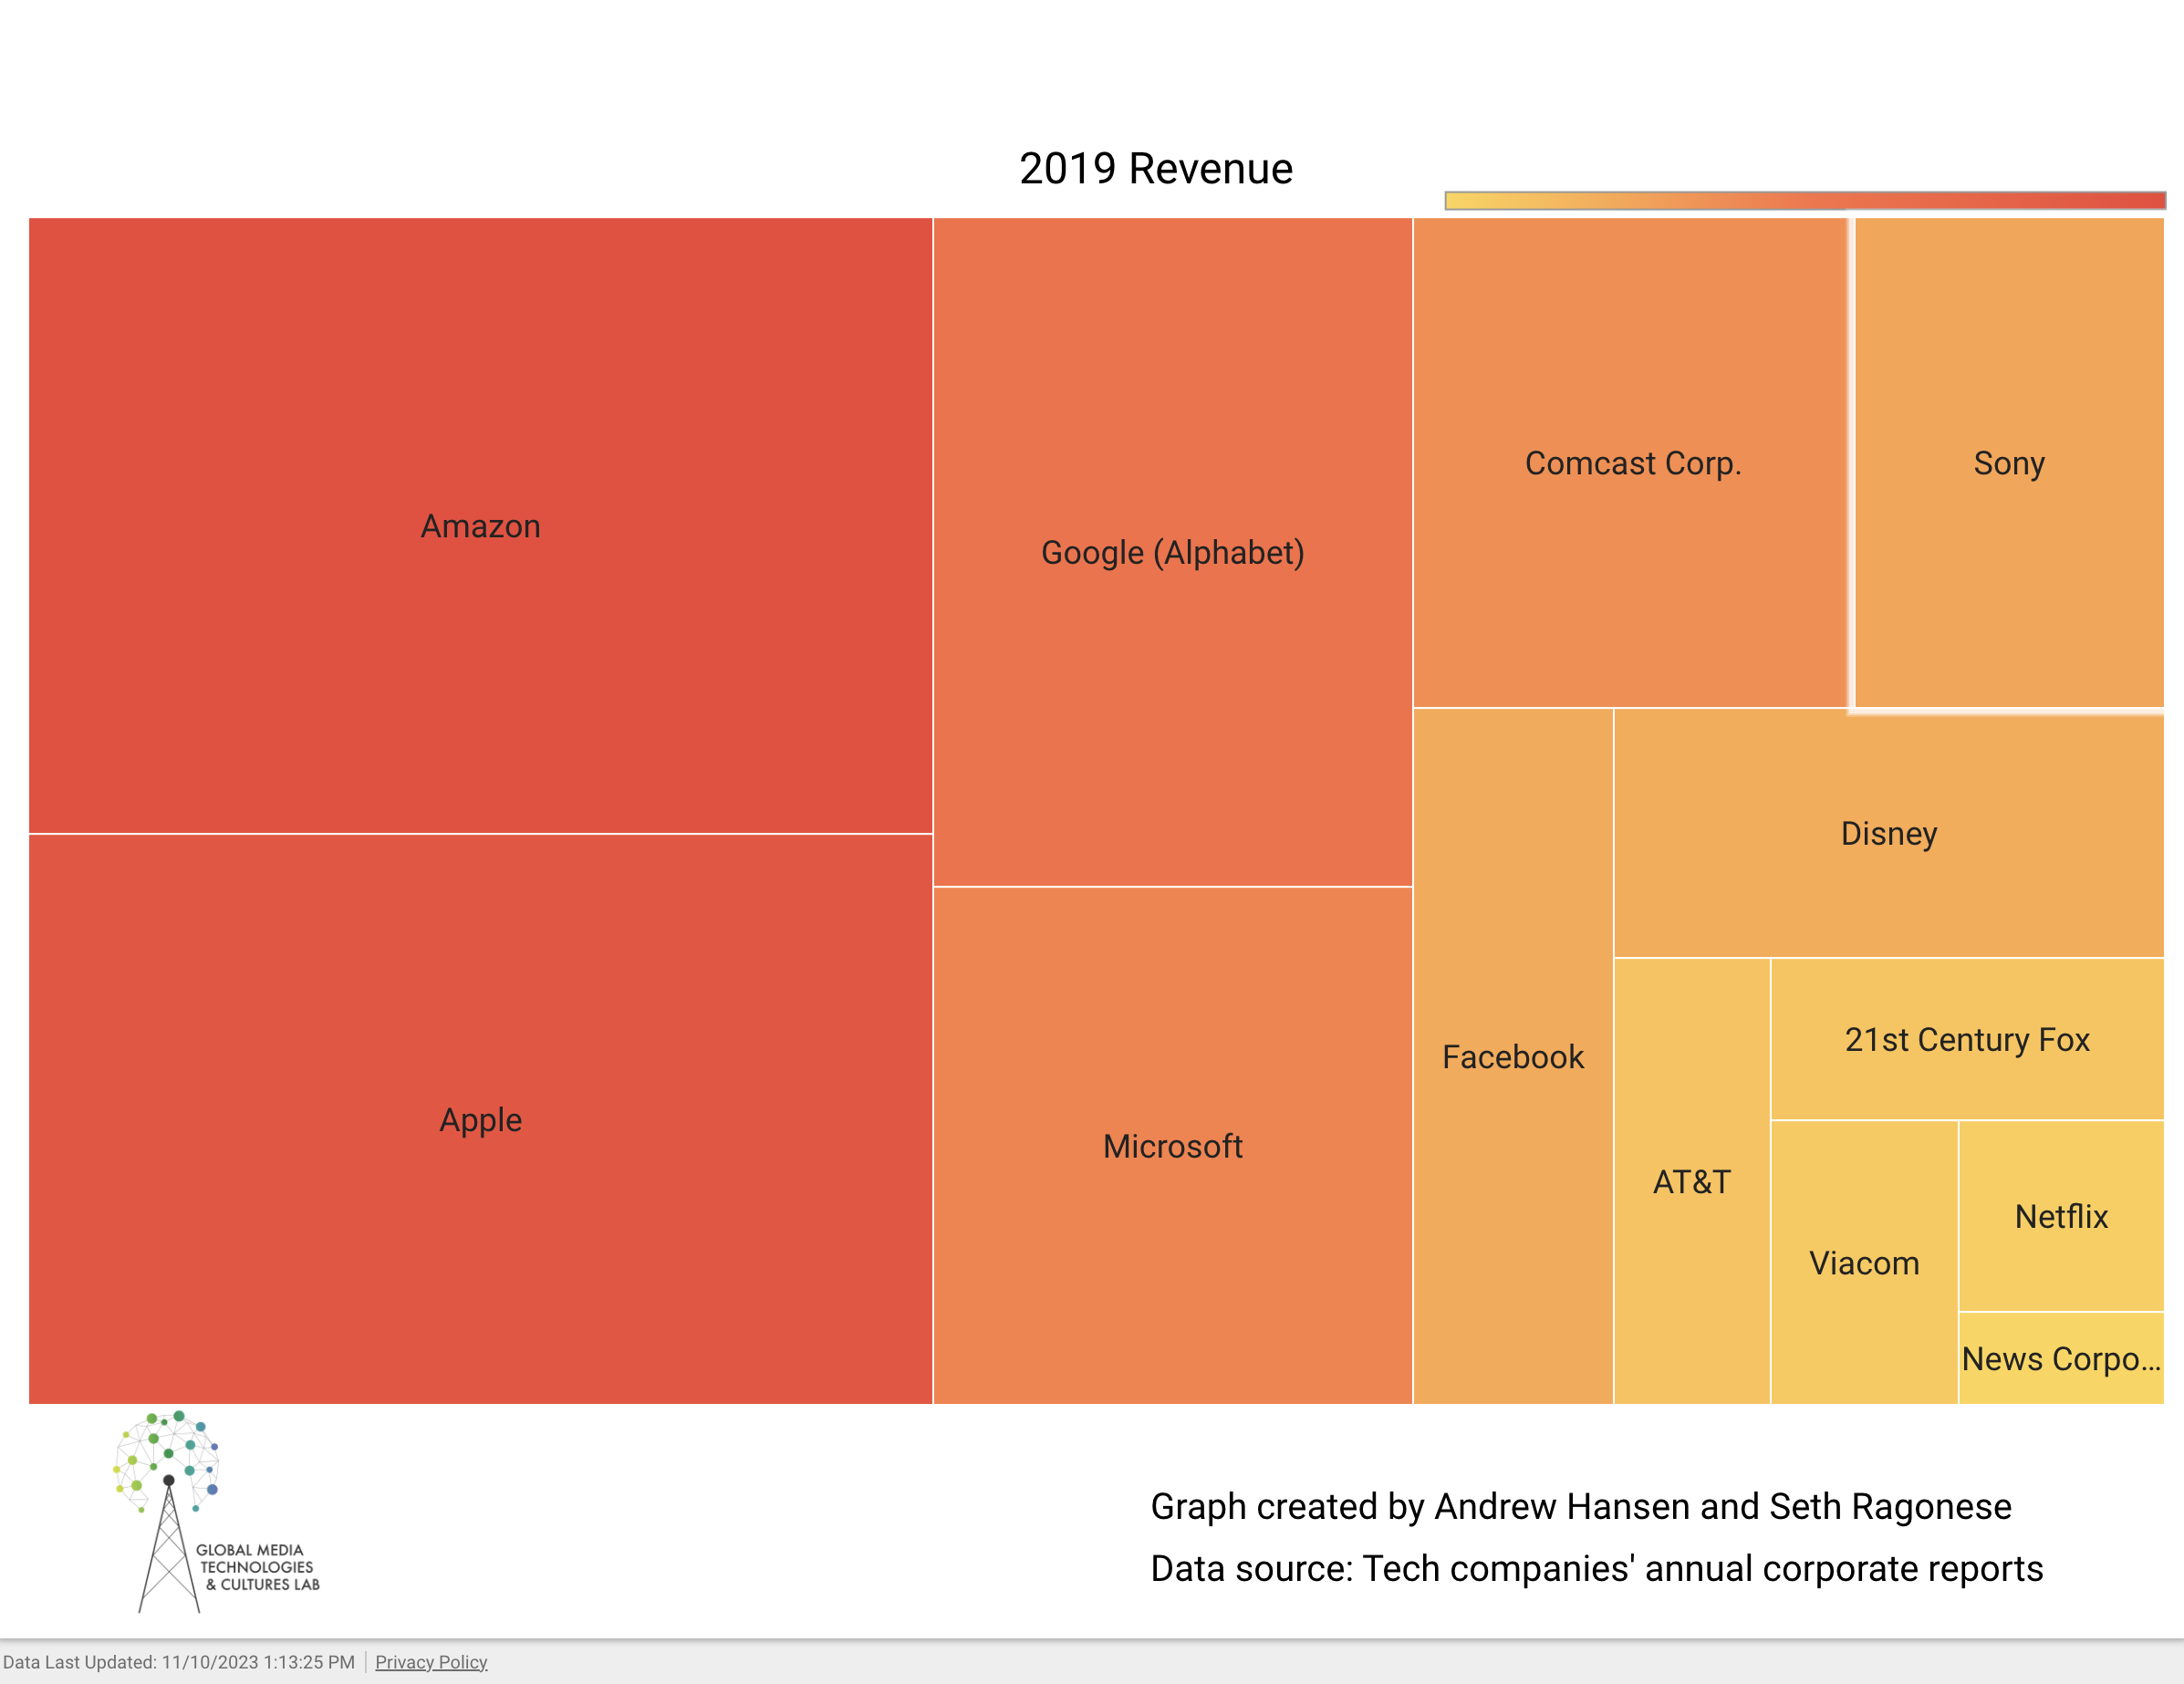
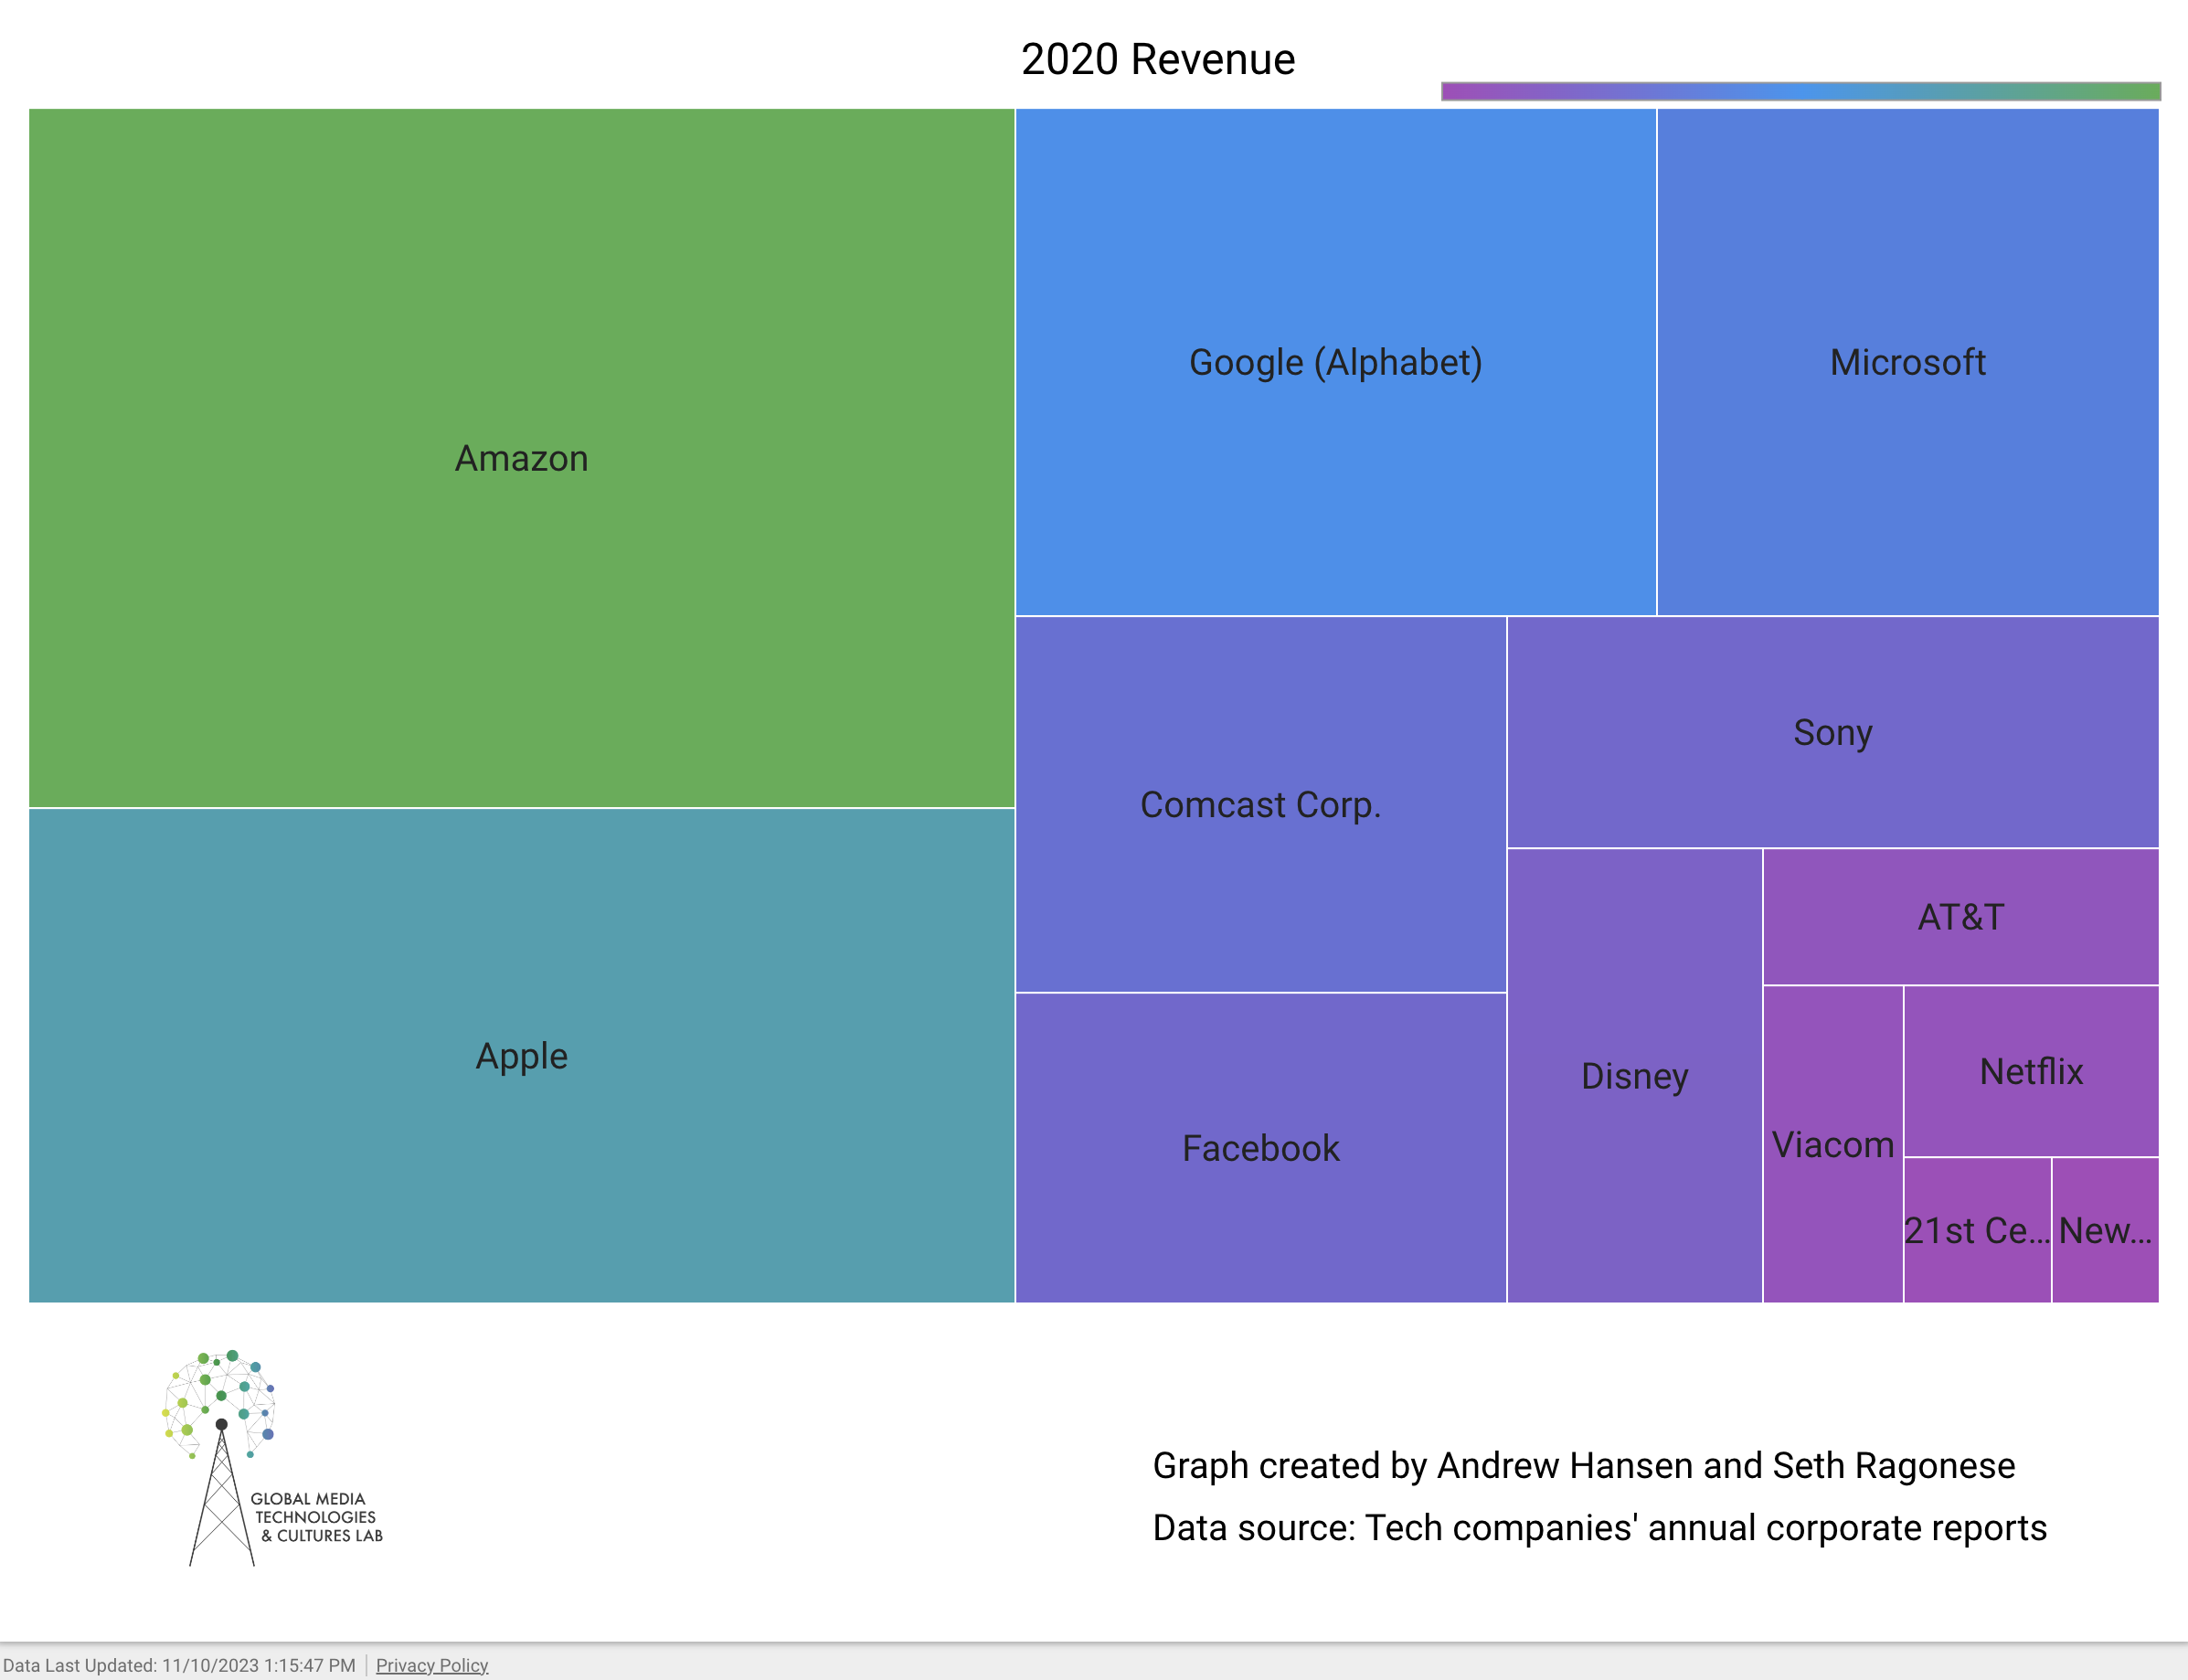
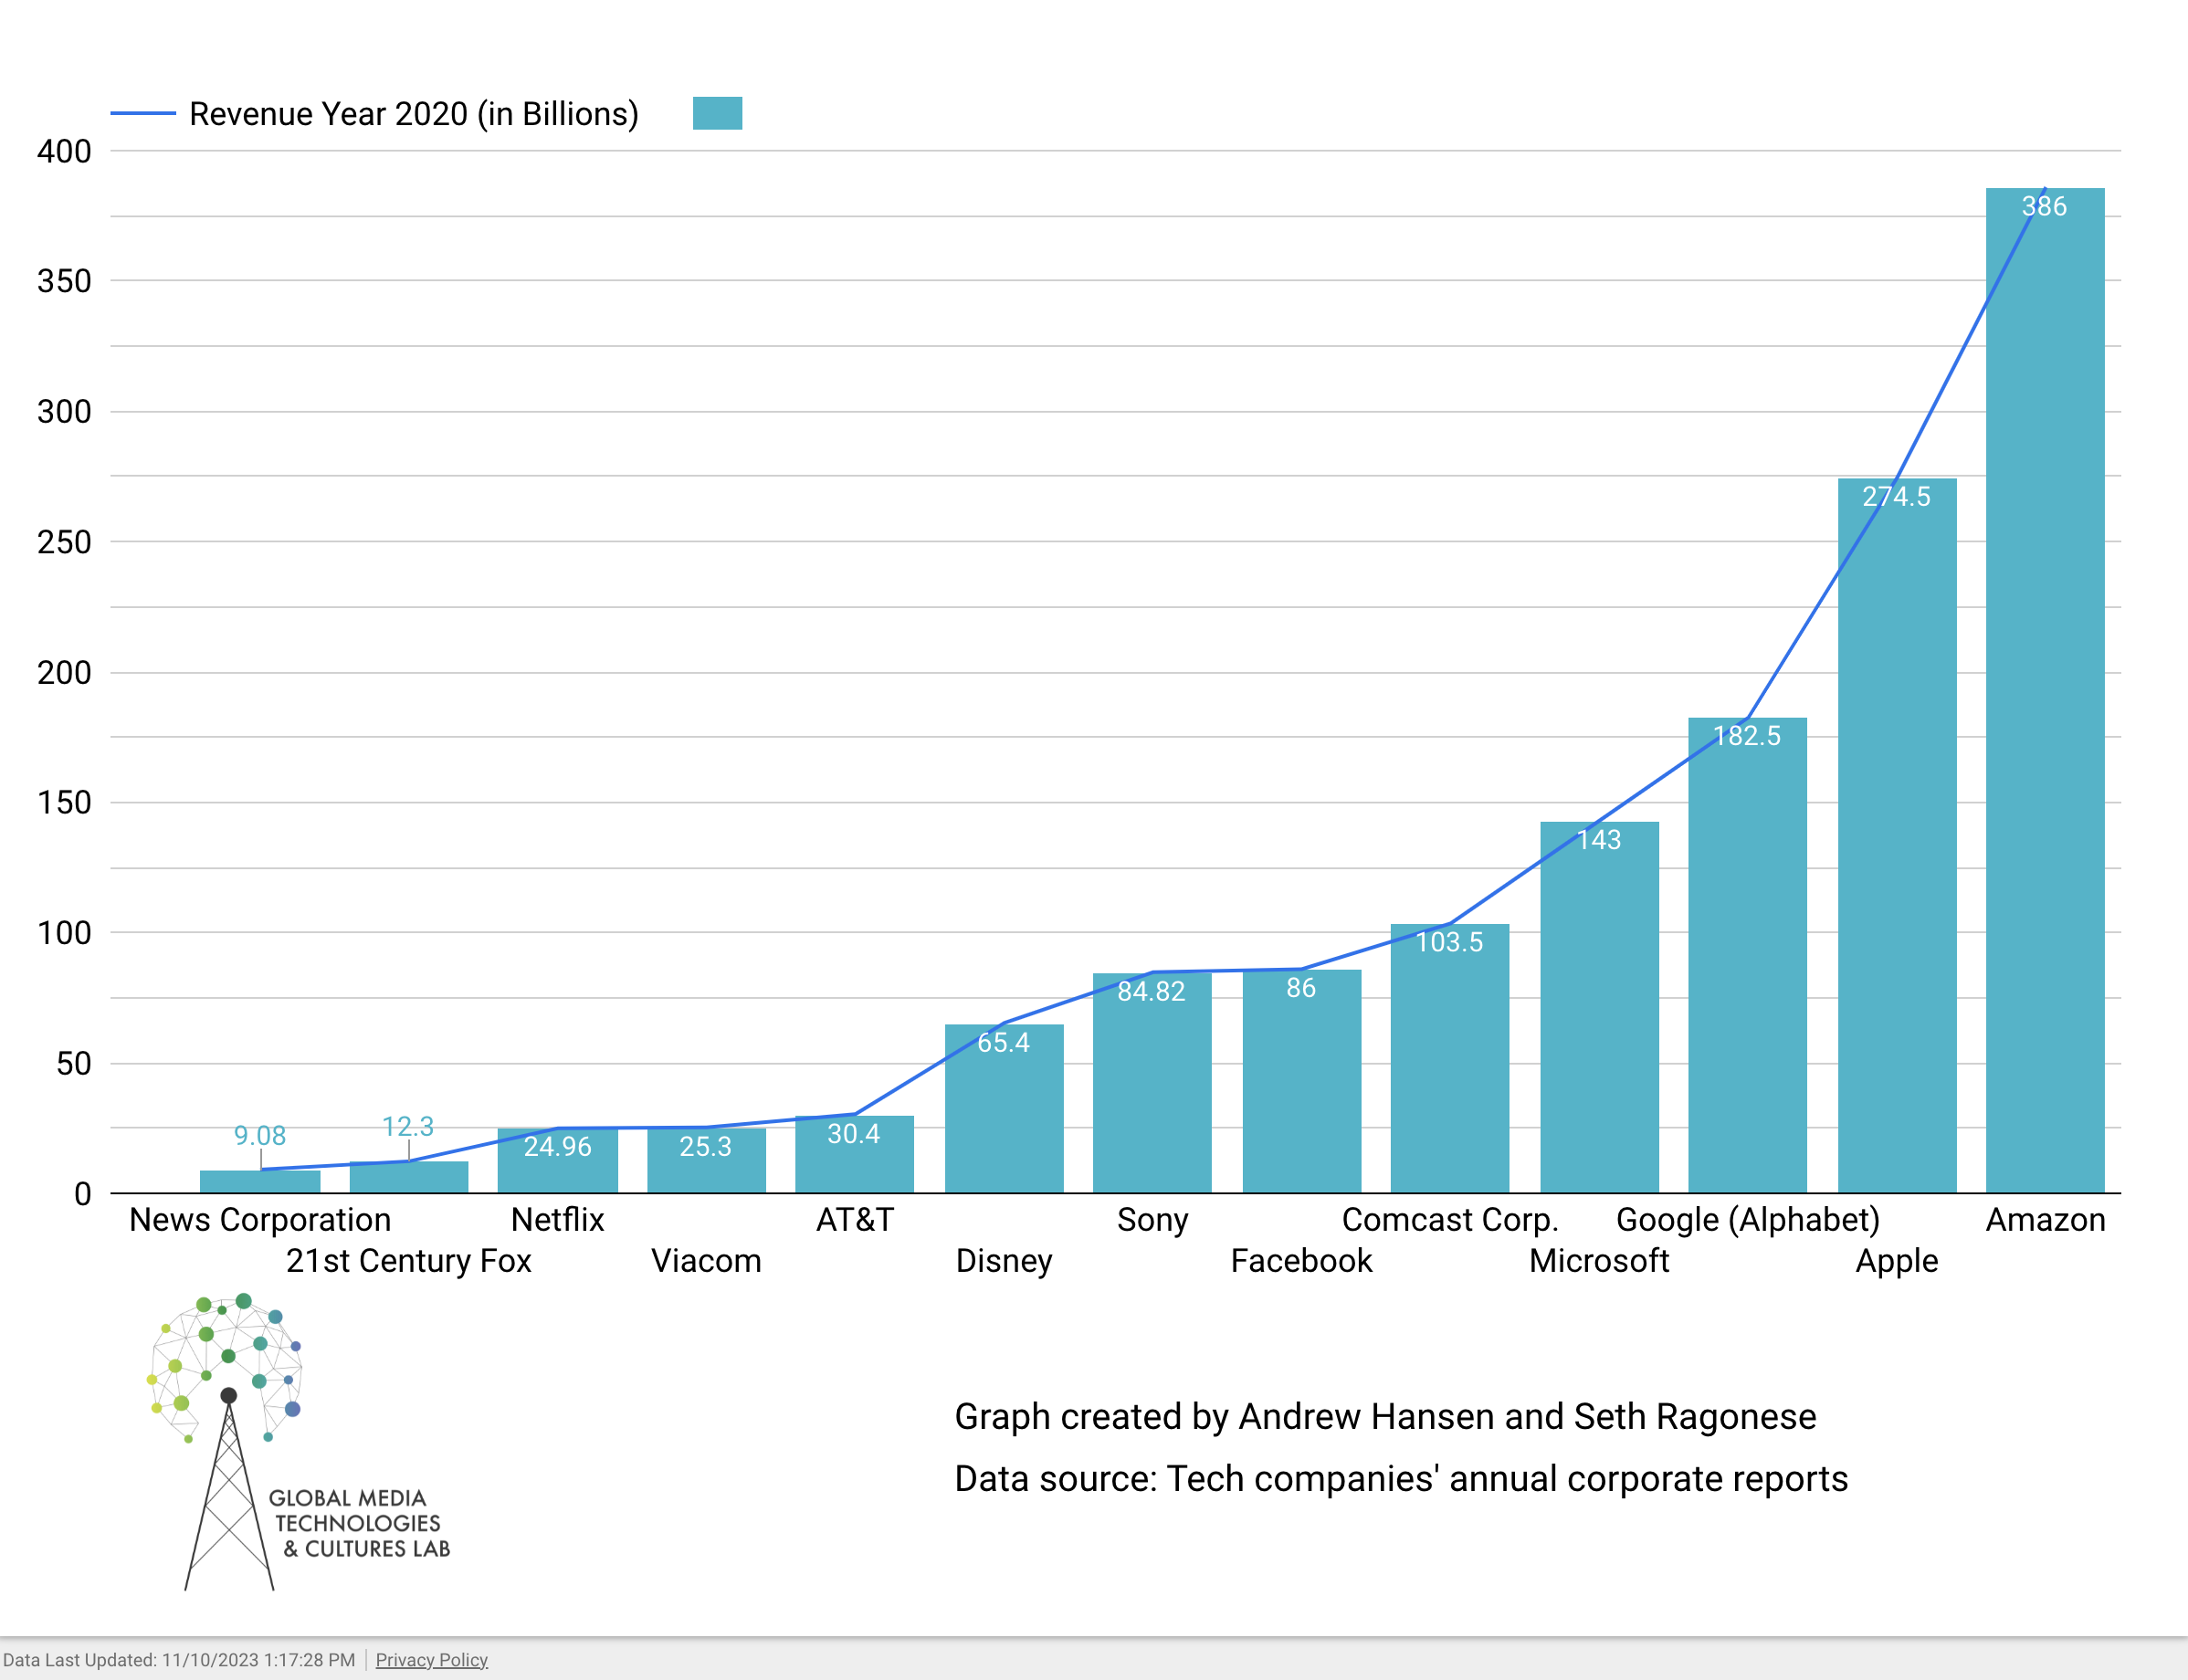
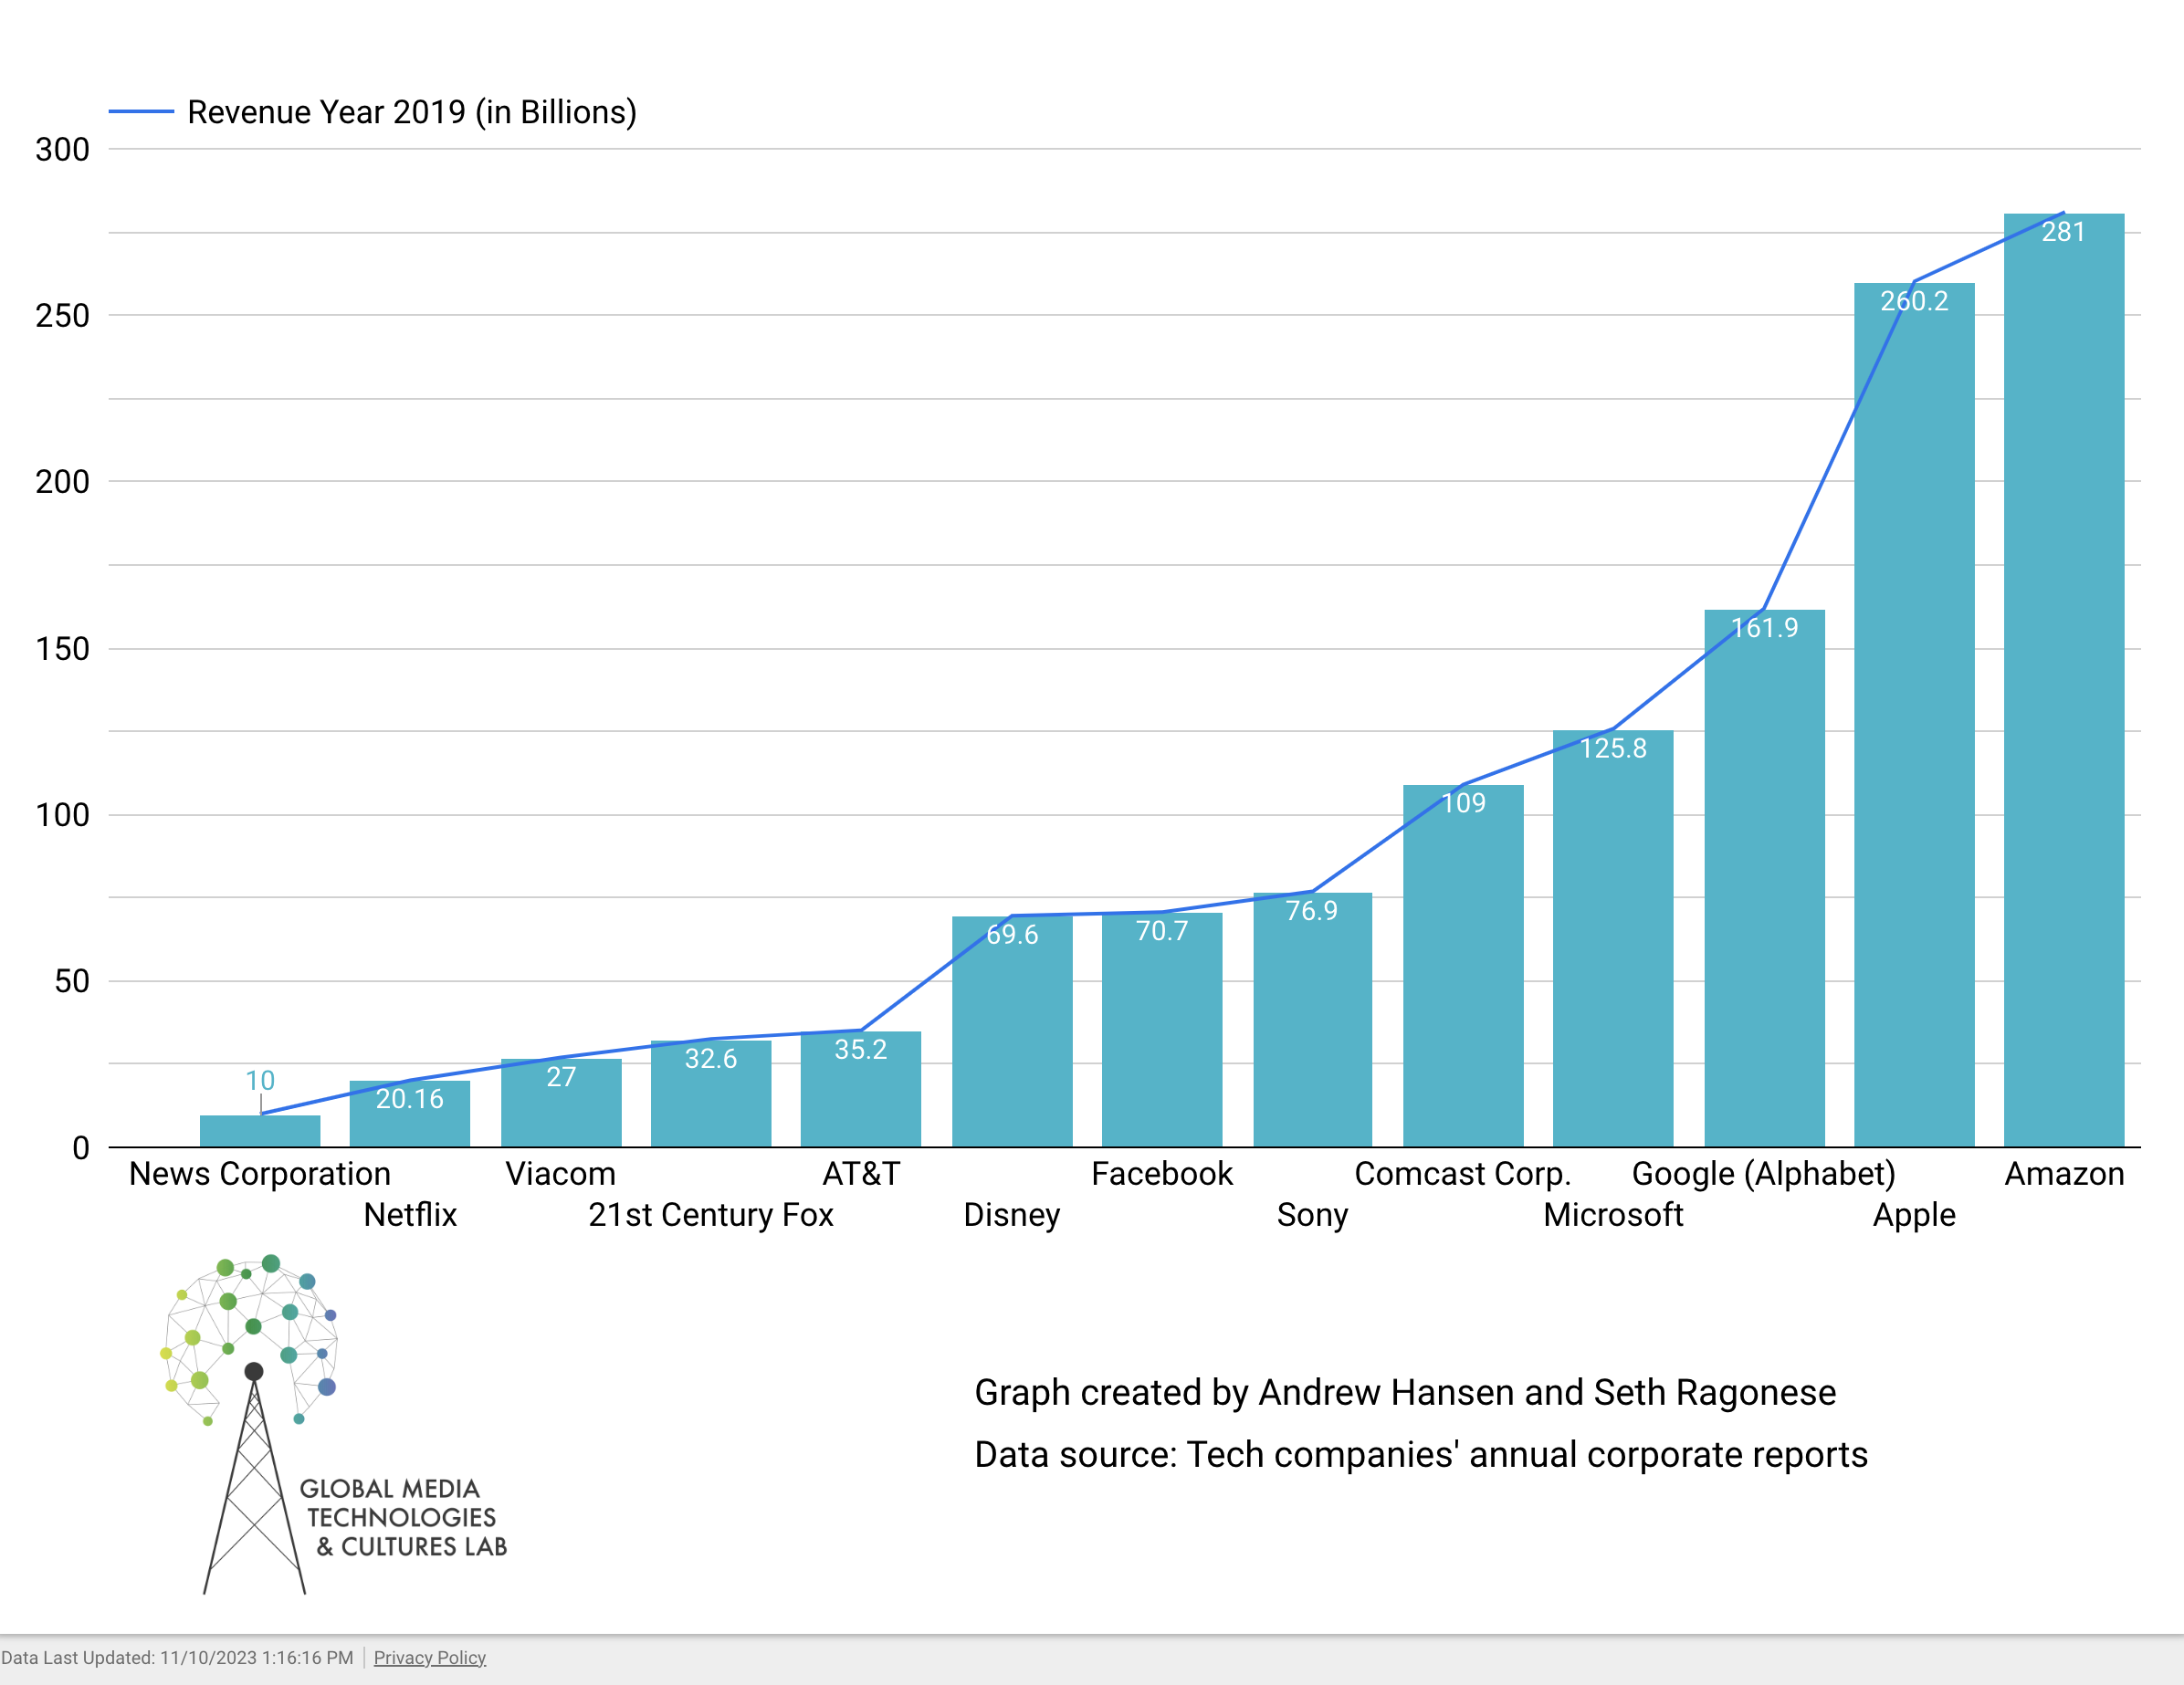
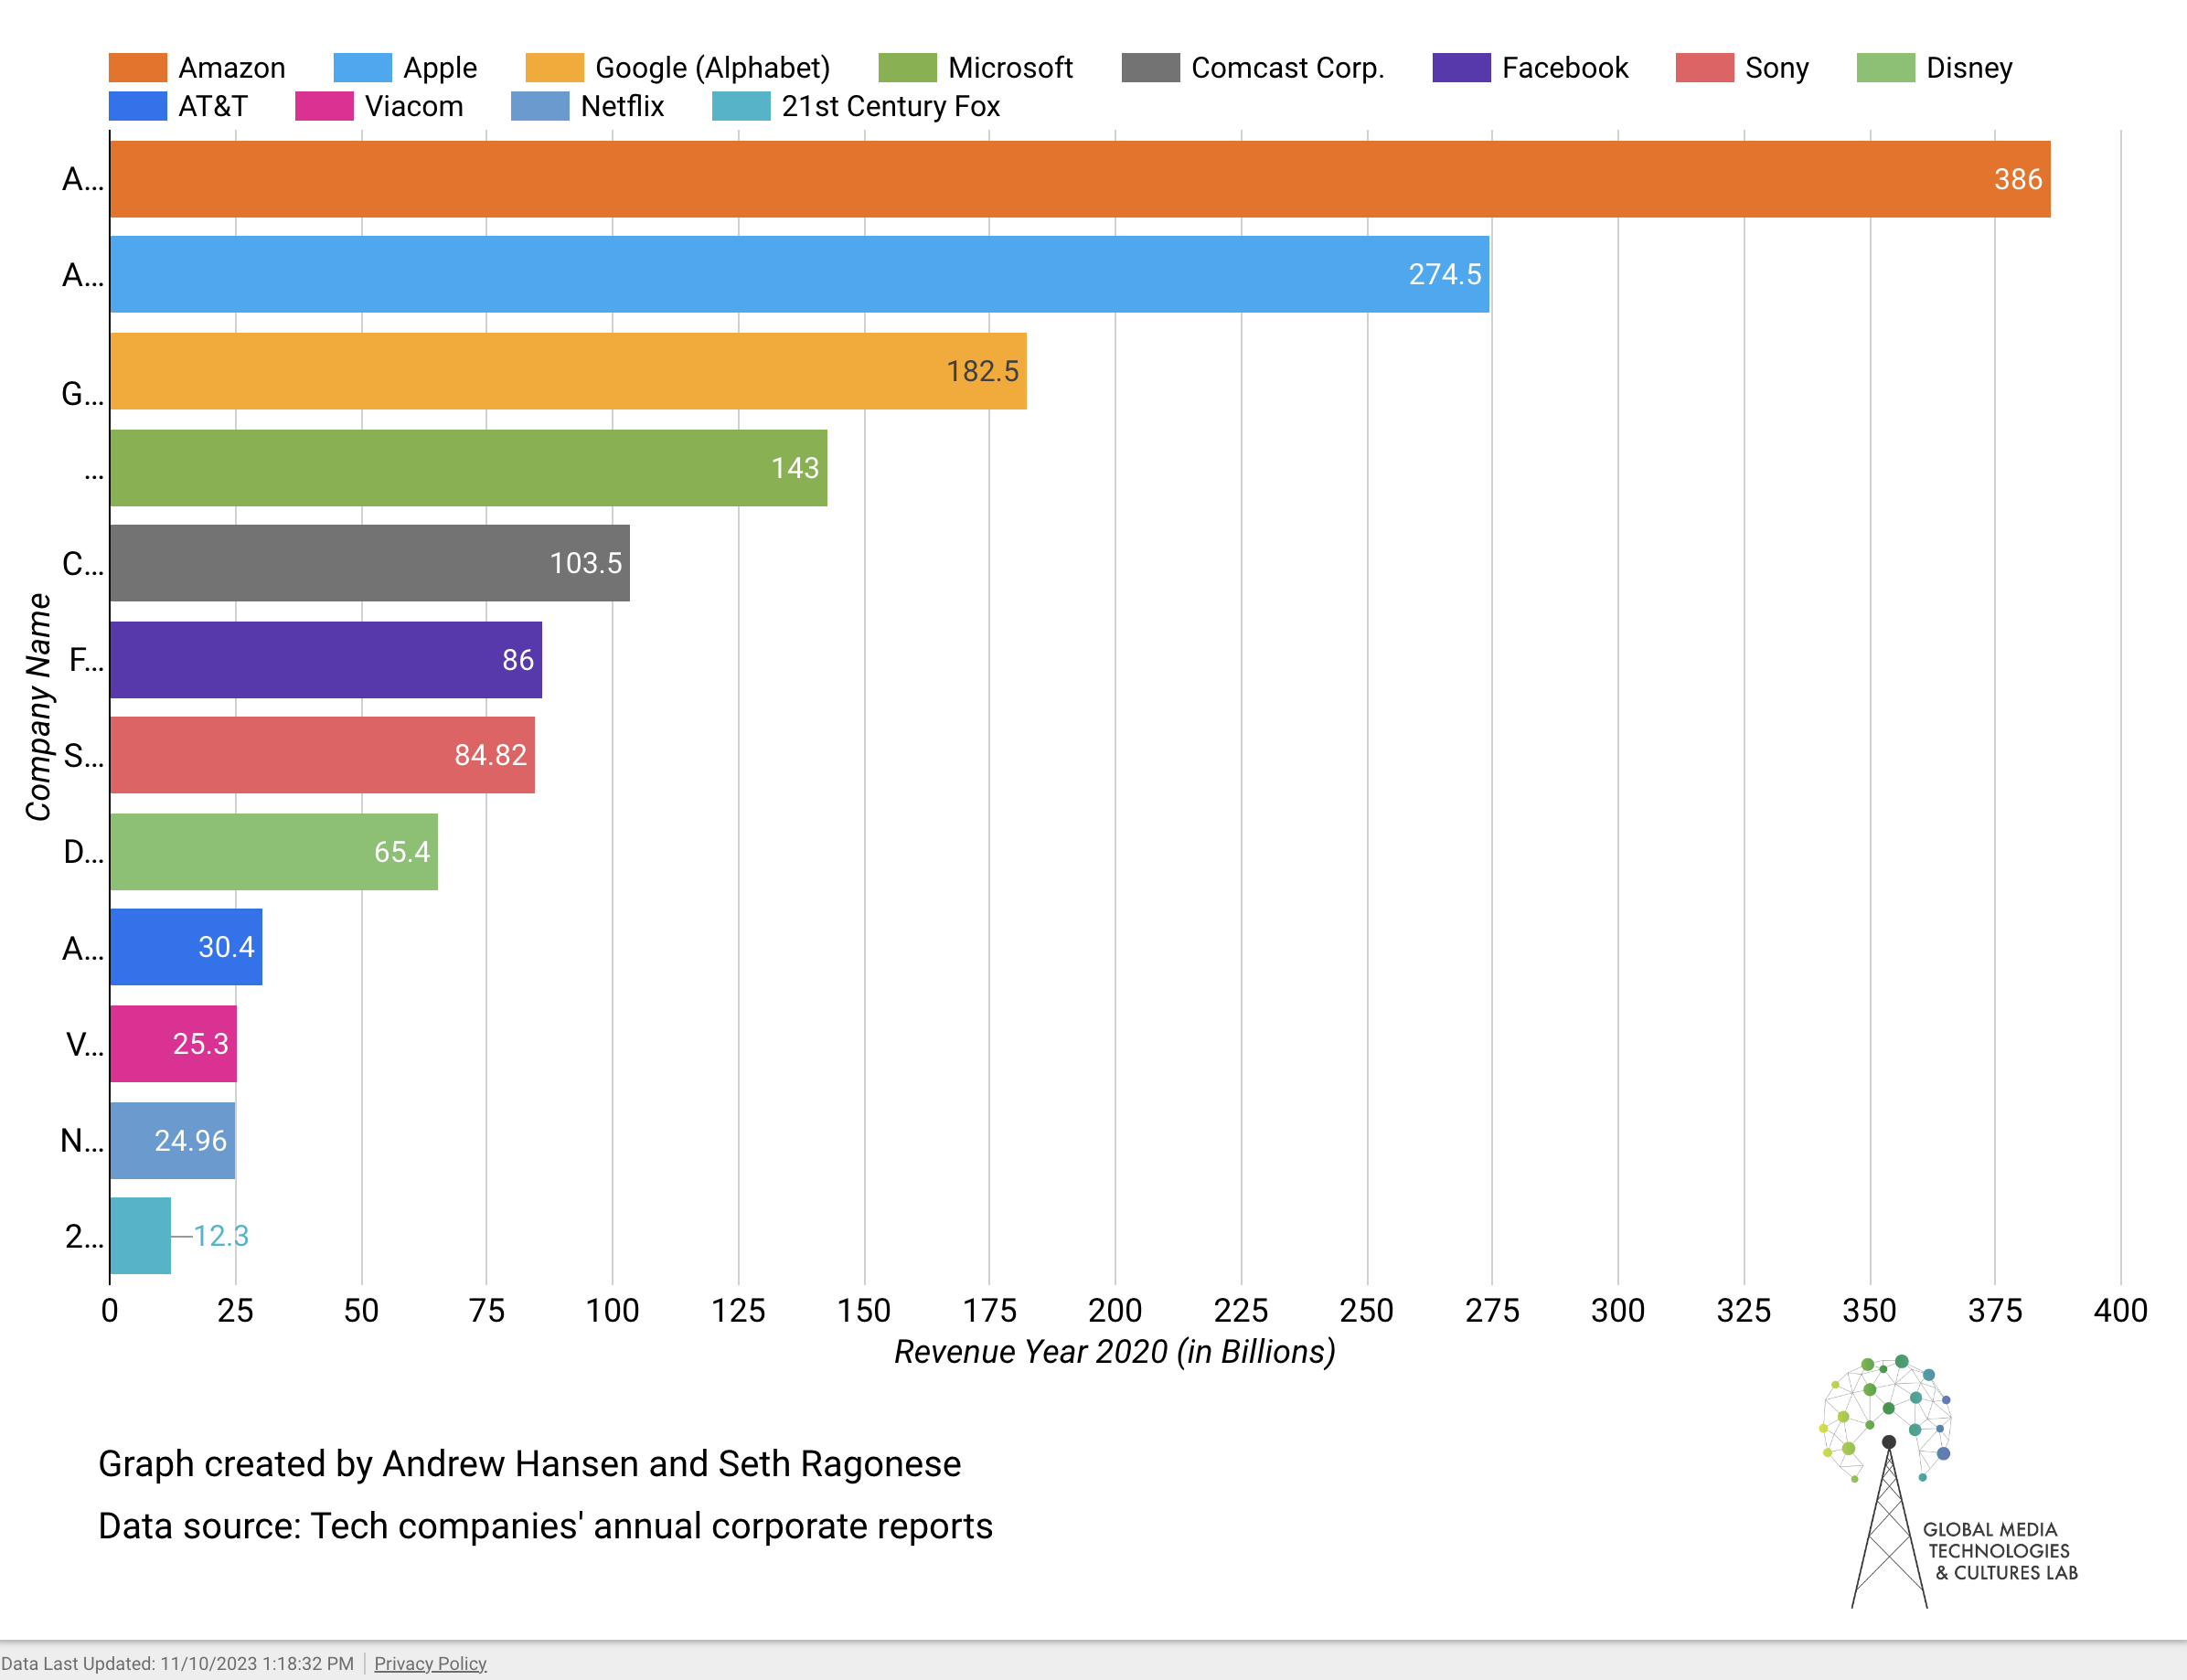
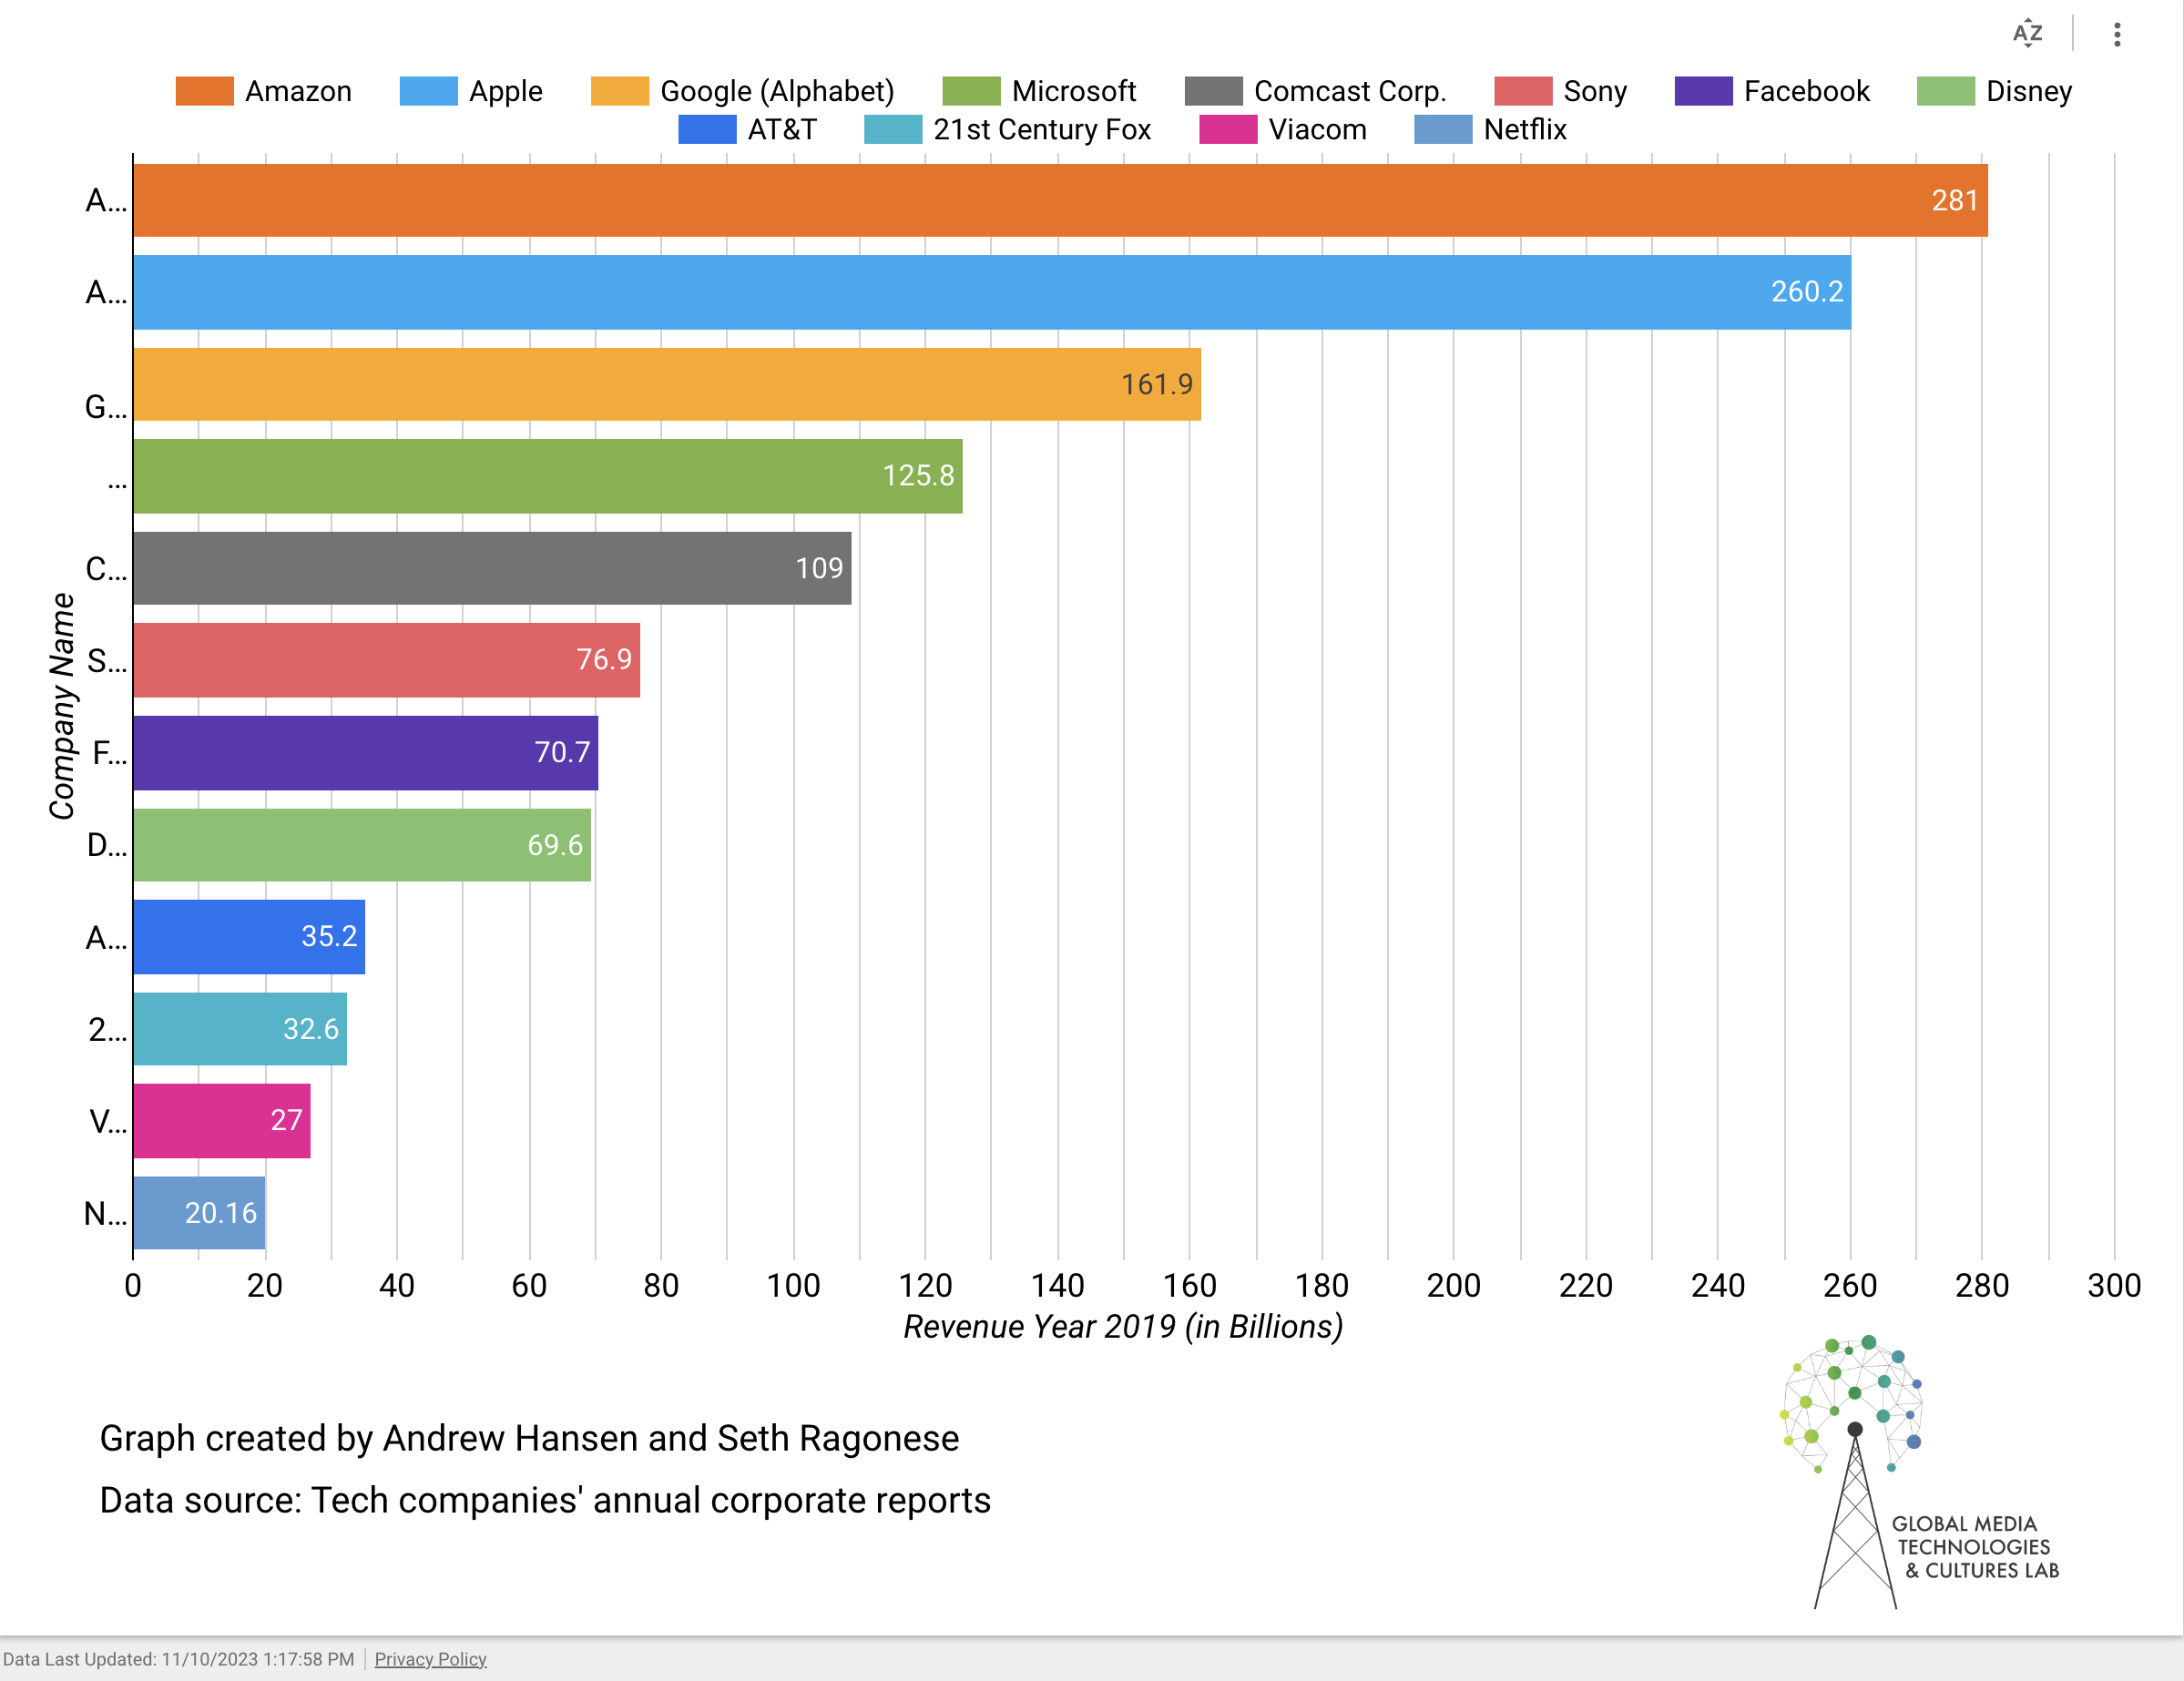
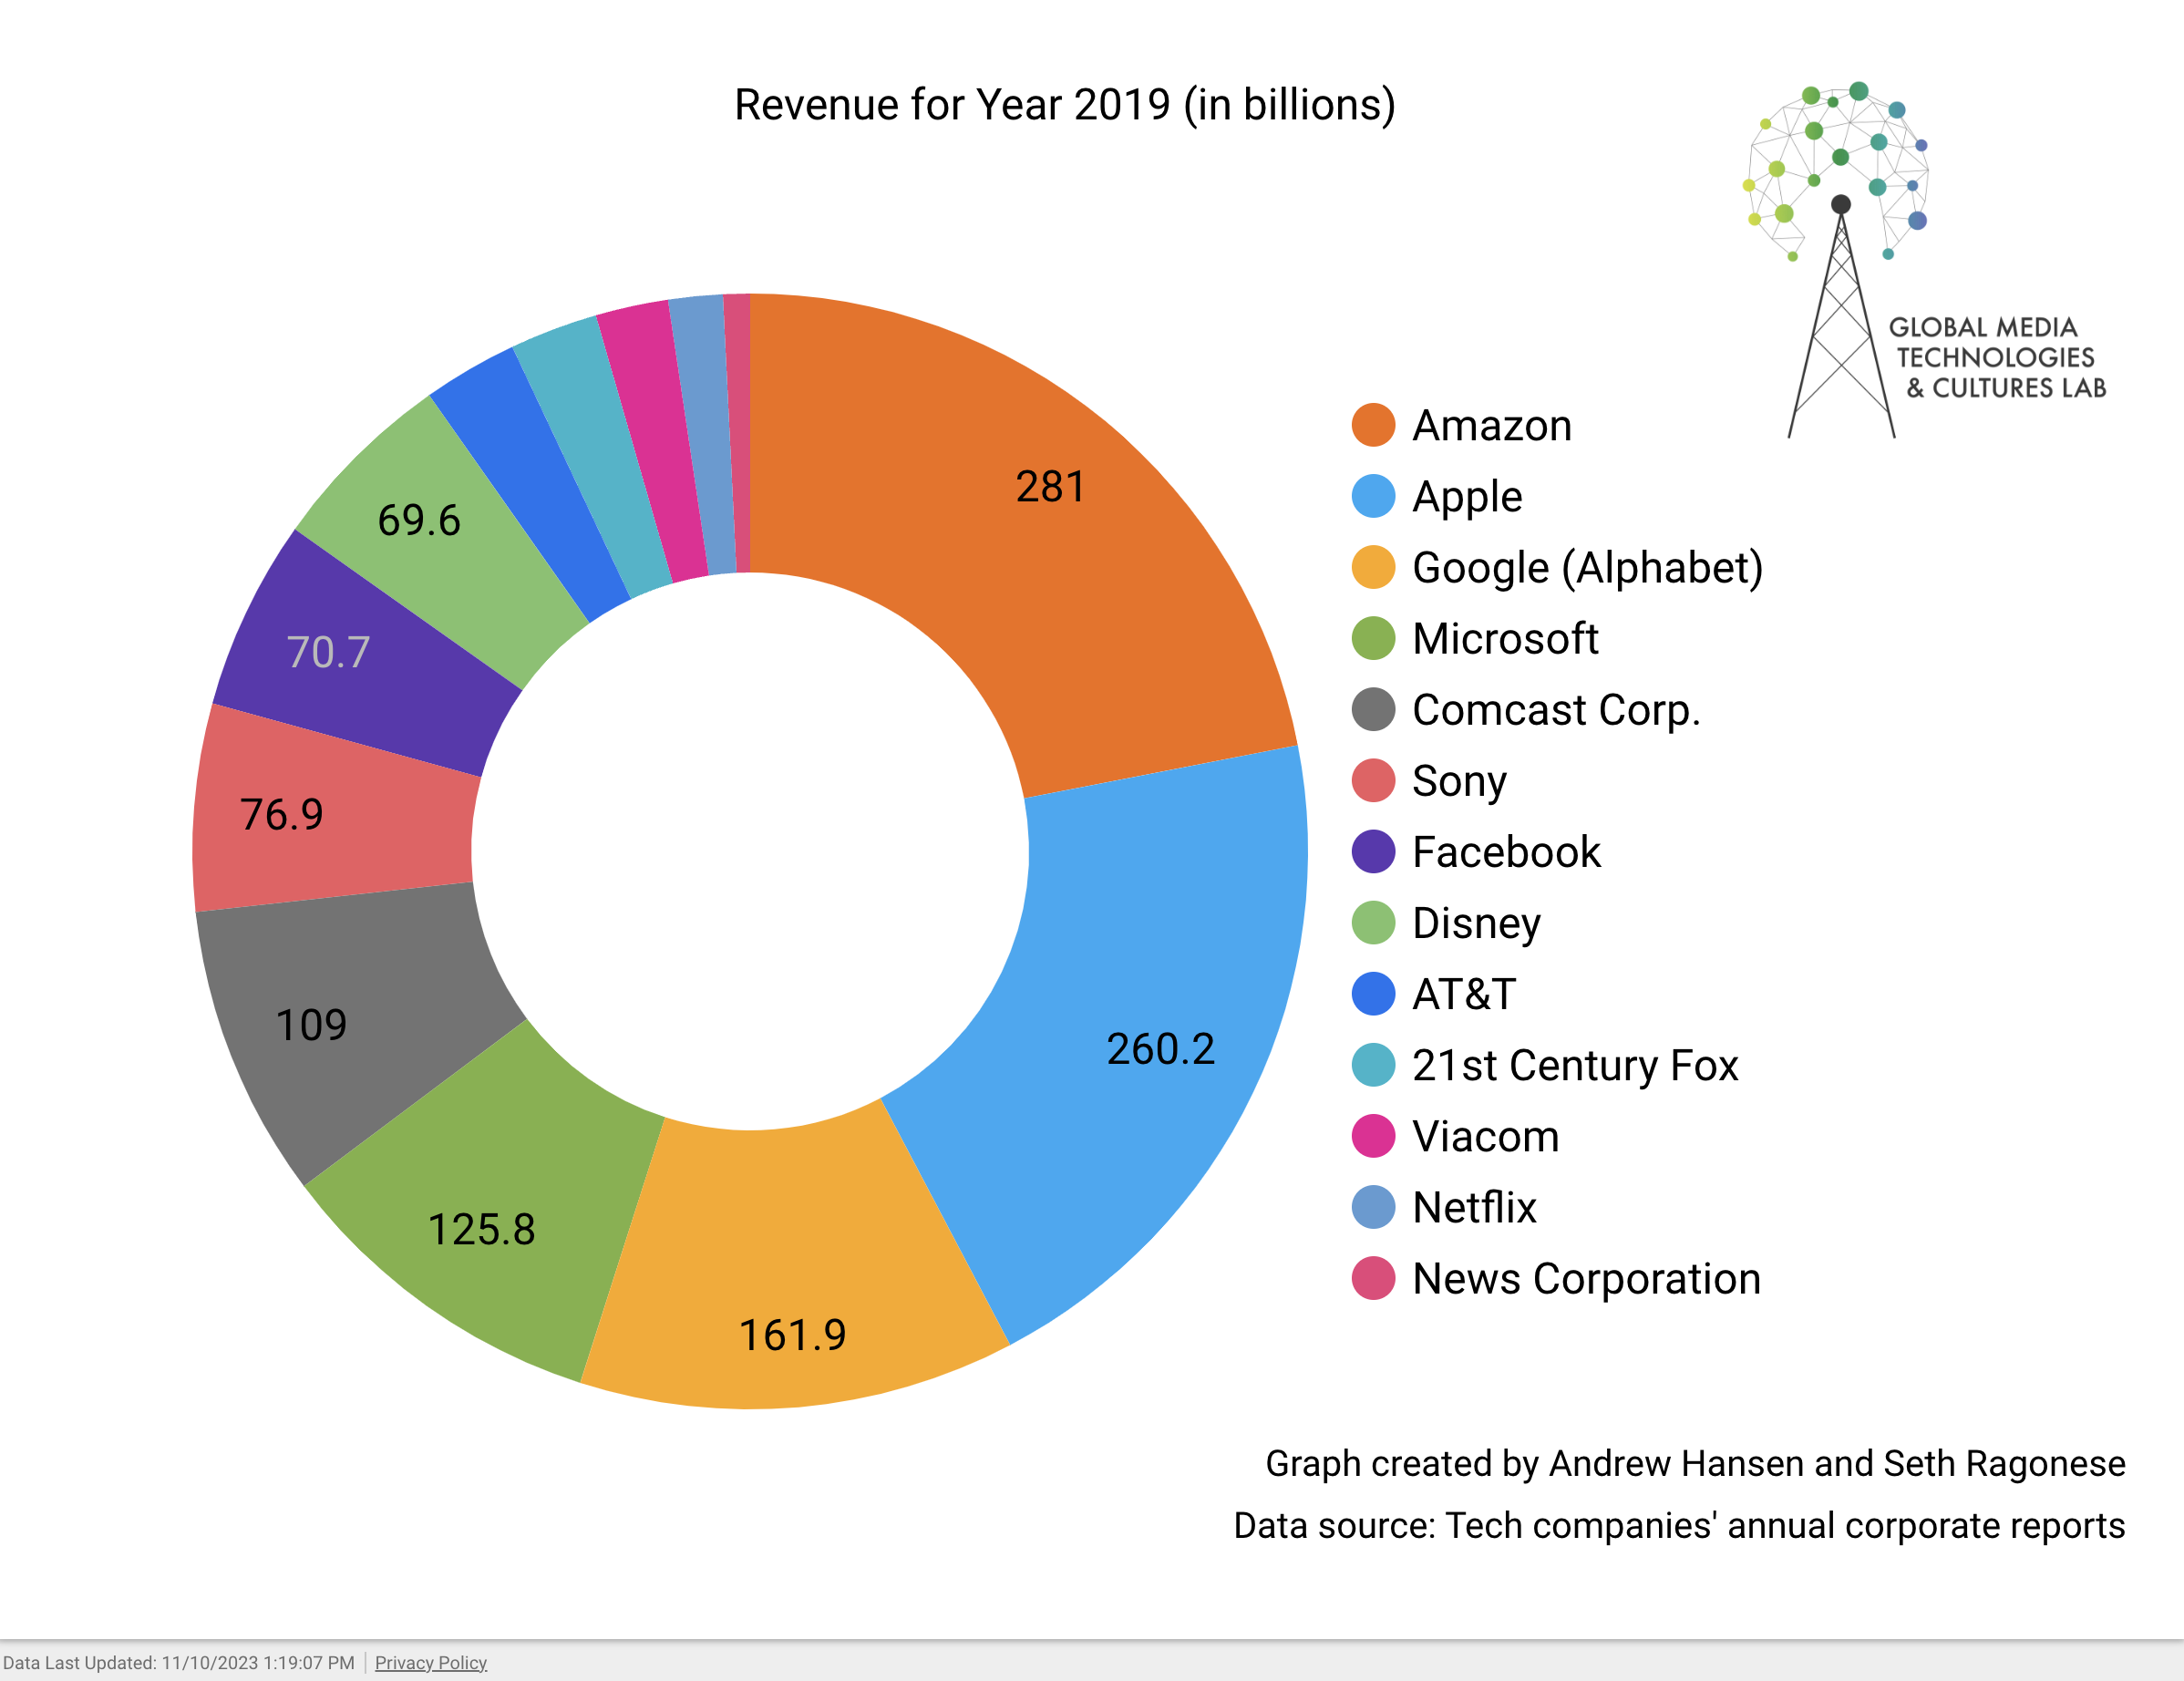
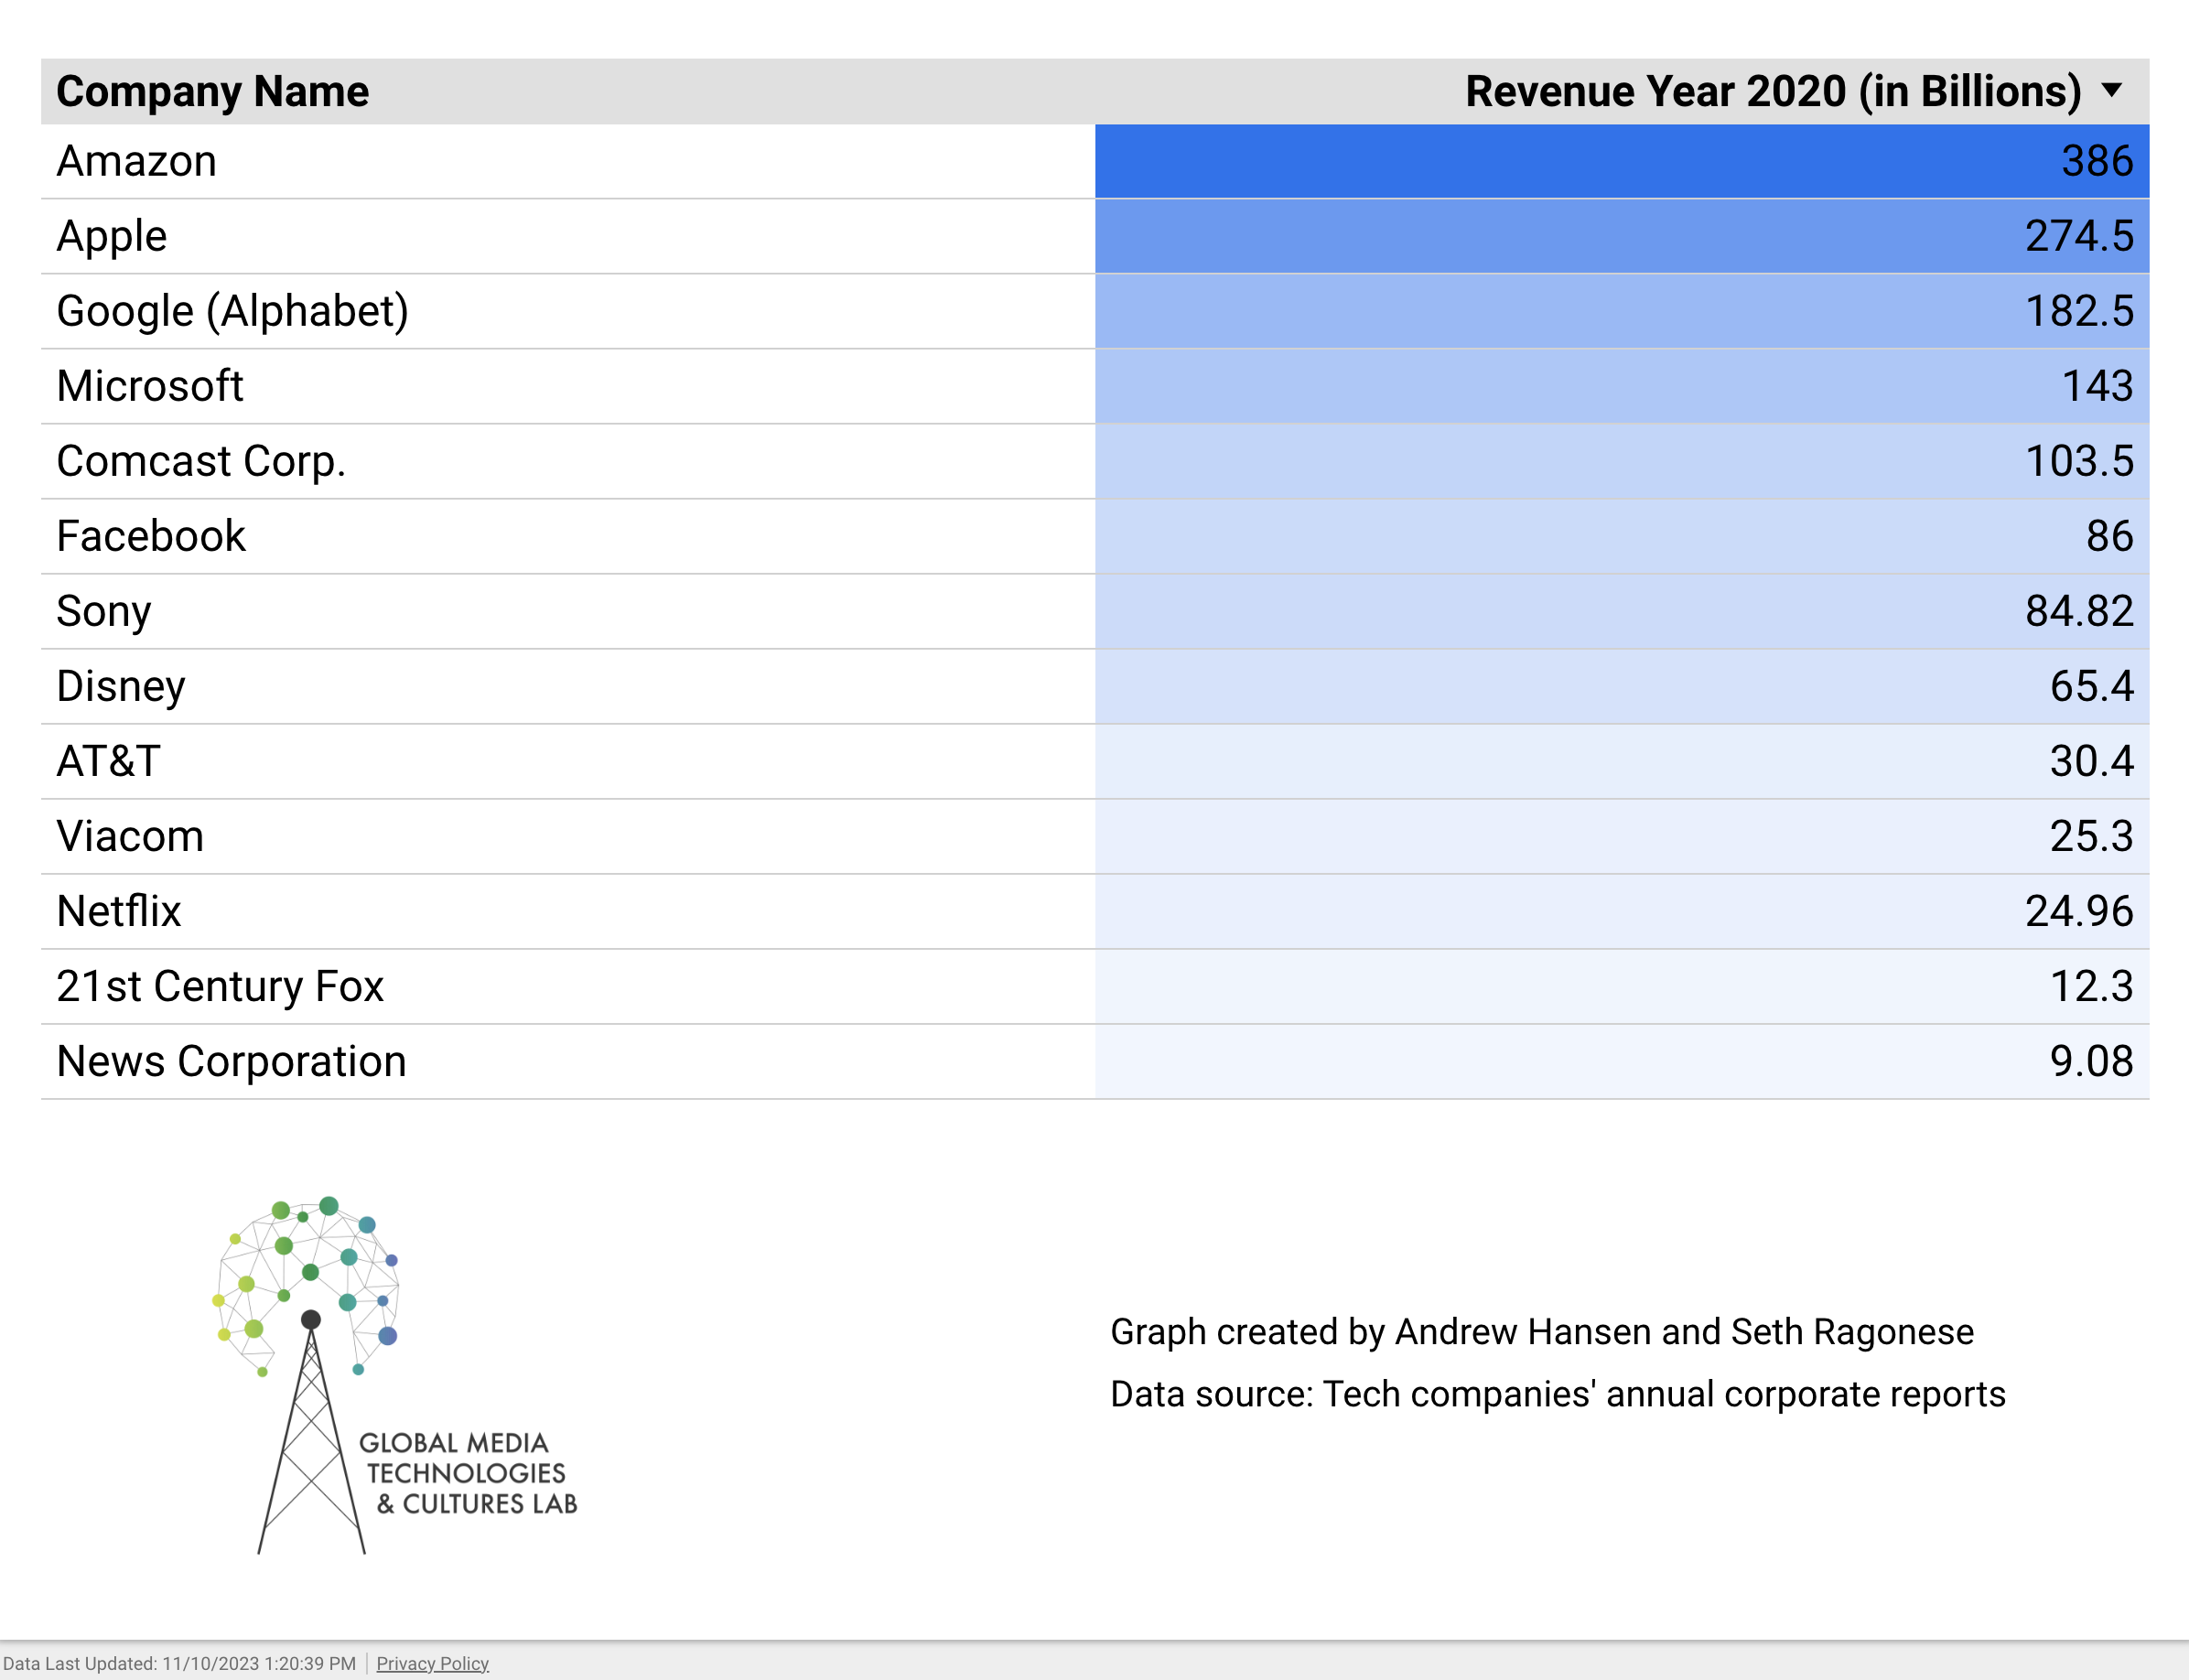
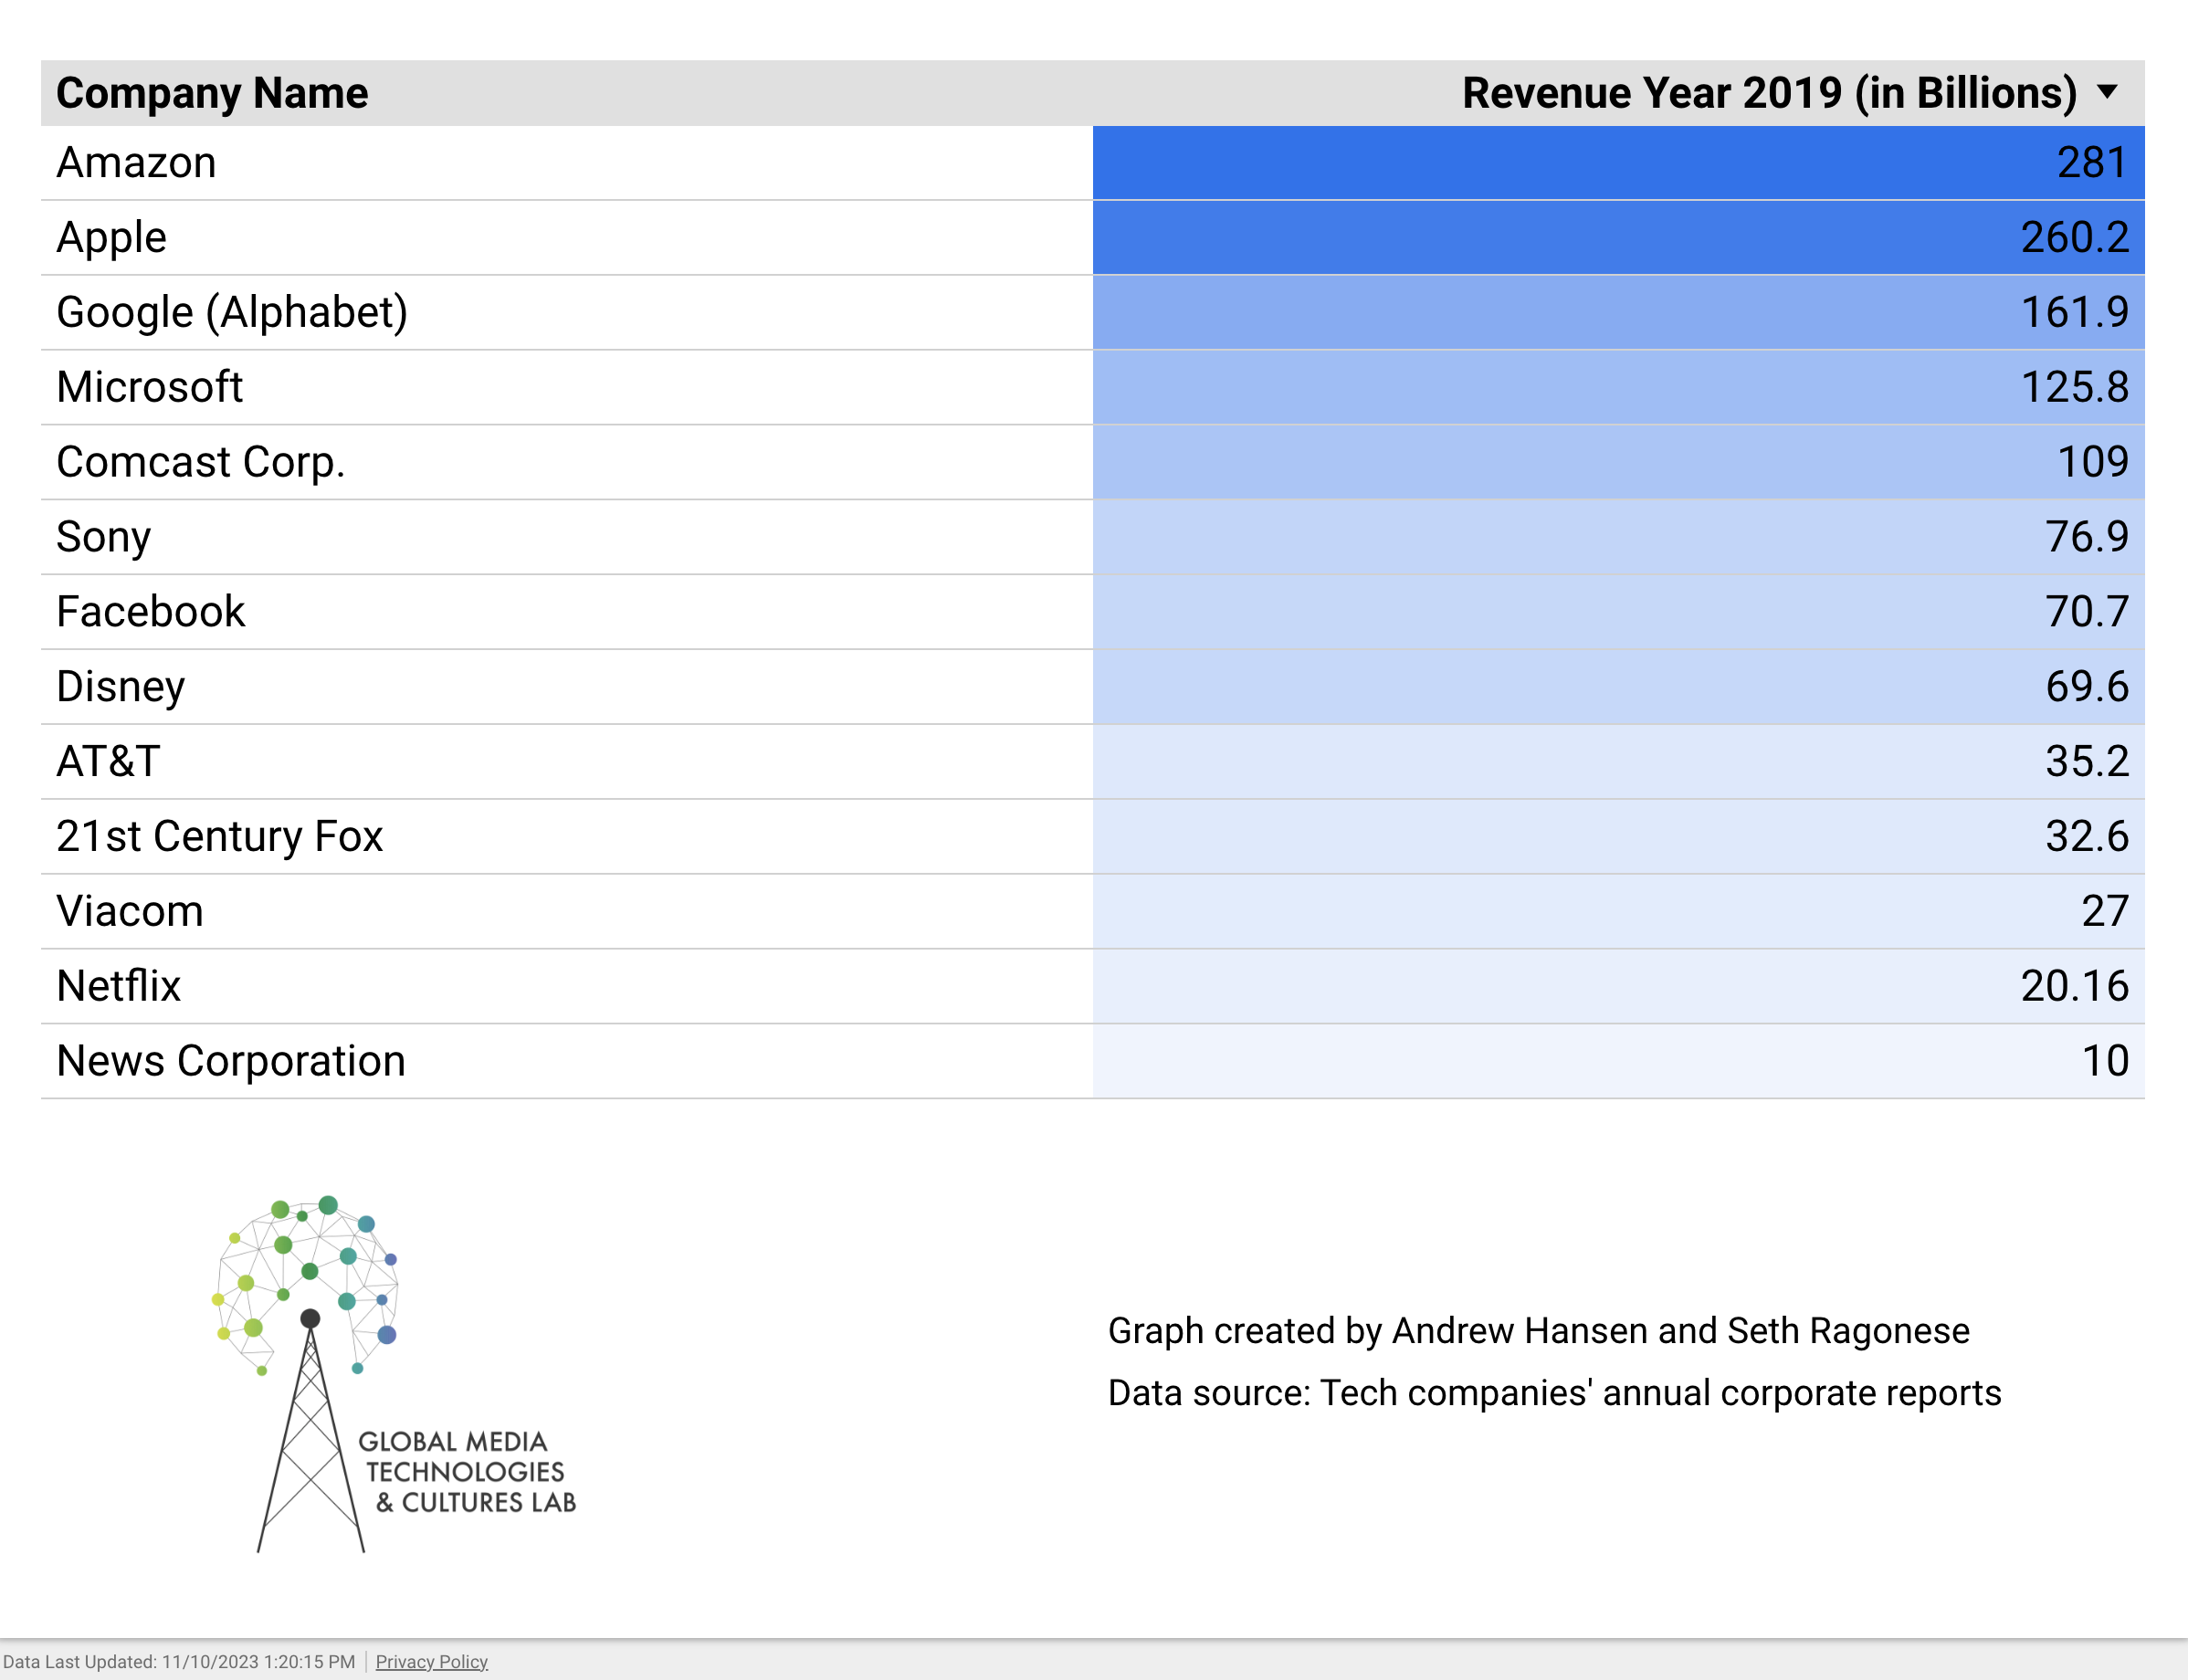
The data visualizations below were created by undergraduate students at the University of California at Santa Barbara in 2022. Research on these companies was originally conducted by Professor Holt, and was updated by student researchers and graphic designers, Andrew Hansen and Seth Ragonese.

WOW Project Blog

